Run your first evaluation
Create a benchmark run, compare a candidate with a pinned baseline, and review the evidence.
Before you begin
You need a benchmark with at least one case and two available models. If the benchmark exercises tools, deploy or connect those tools before starting.
1. Open a new run
From the dashboard, select New run. Choose a benchmark and confirm its version. Trunchbull displays the number of cases and the scoring families that will participate in the decision.
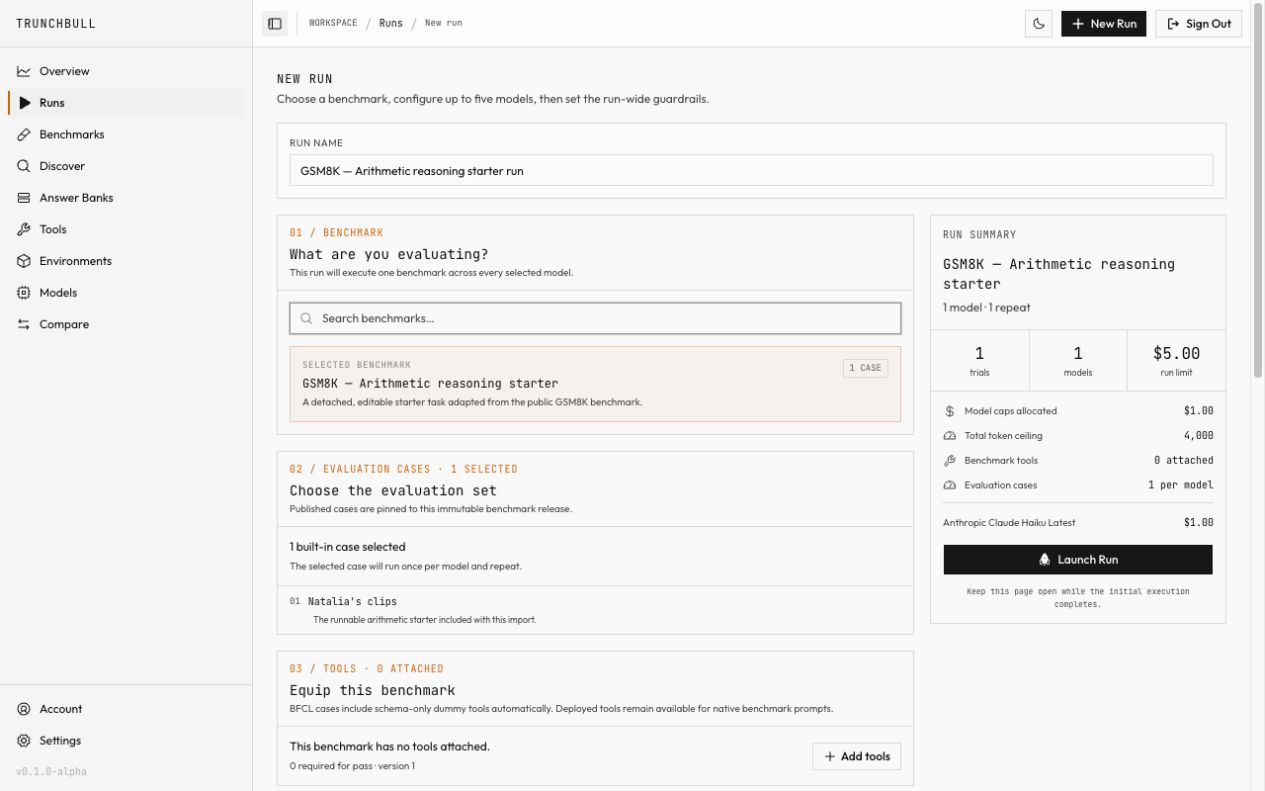
Selecting a benchmark immediately resolves its evaluation cases, tools, and initial run estimate.
2. Pin the baseline
Select the model currently trusted in production as the baseline. Add one or more candidate models, then keep generation parameters aligned unless the experiment is explicitly testing those parameters.
A clean comparison changes one thing
When selecting a new model, hold the benchmark, tools, answer bank, and run limits constant. This makes the model the independent variable.
3. Set execution limits
Use explicit ceilings to contain runaway agents and make cost comparisons meaningful.
| Configuration | Recommended start | Why it matters |
|---|---|---|
| Repeats per case and model | 1 | Establishes the total trial count |
| Max model steps per trial | 12 | Prevents unbounded tool loops |
| Max output tokens per call | 512 | Fits a concise grounded response |
| Max total tokens | Use the builder recommendation | Covers the complete run matrix |
| Max run spend | $5.00 | Creates a hard run-wide cost stop |
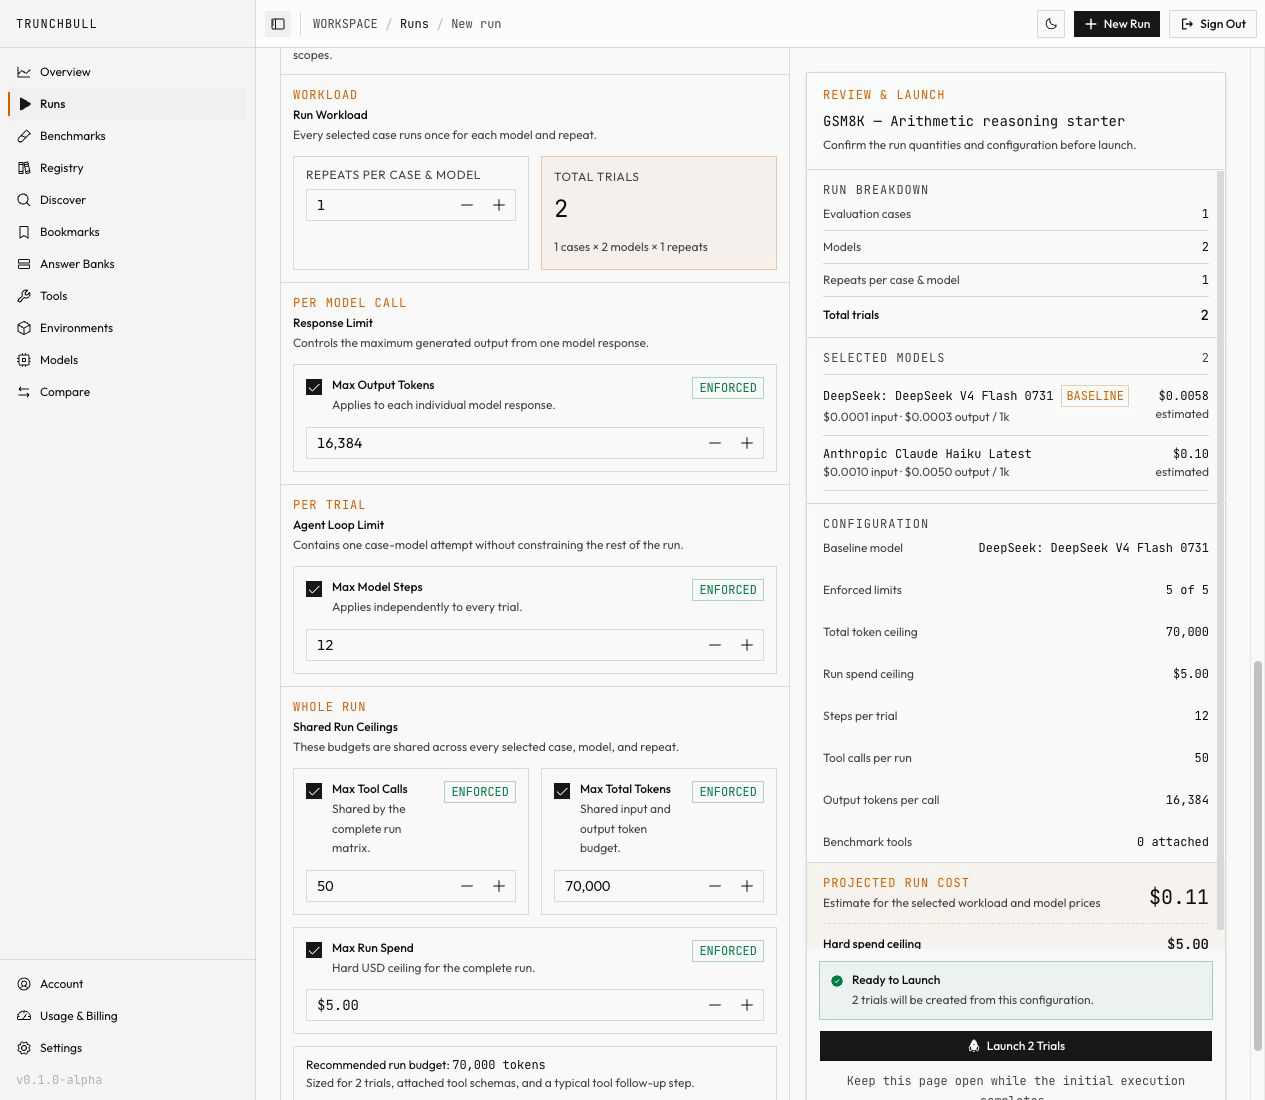
The baseline, total trial count, scoped limits, projected cost, and hard spend ceiling are reviewed together before launch.
4. Launch and monitor
The run matrix updates as each case completes. A run remains reviewable even when individual cases fail because execution errors are separated from scored model failures.
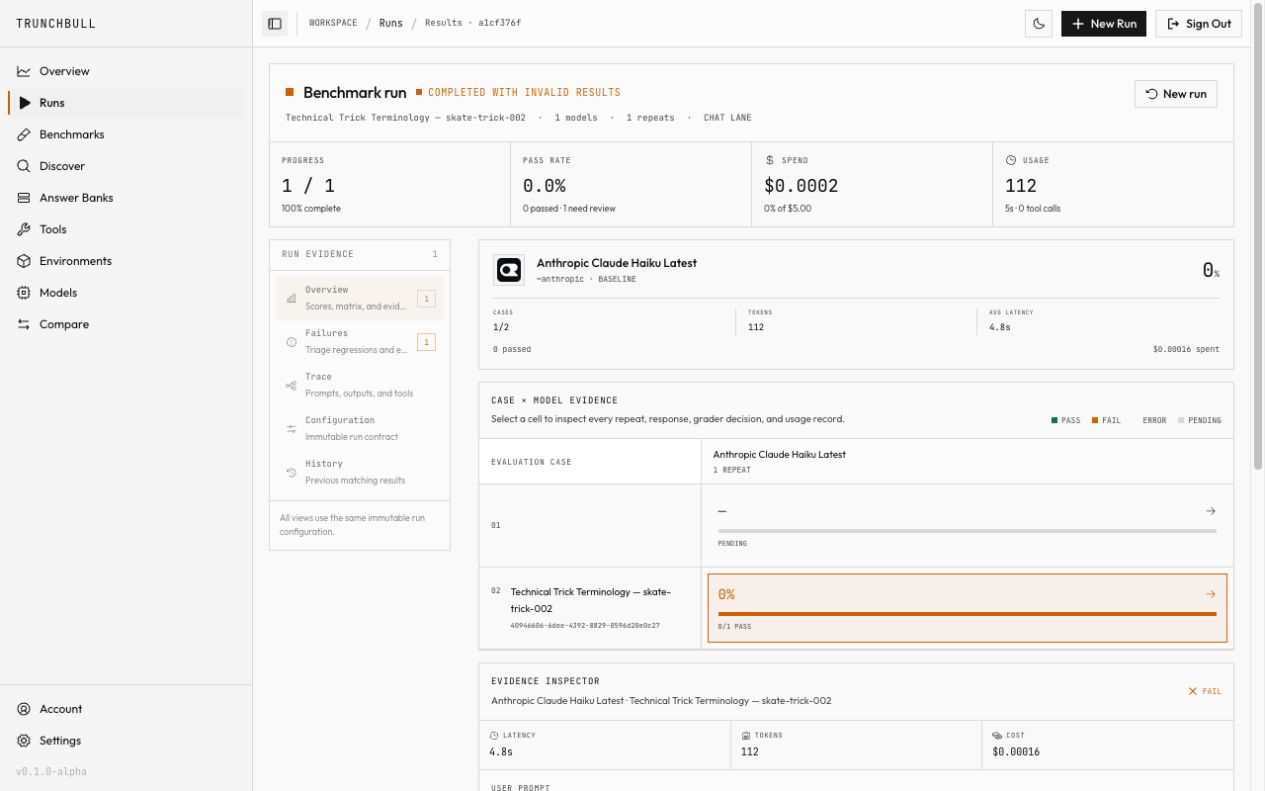
The overview keeps outcome, spend, usage, model scores, and case-level evidence in one review surface.
5. Review the decision
Start with family-level deltas, then open any regression. Use the transcript to read the model response in context and the trace to inspect tool arguments, results, latency, and errors.
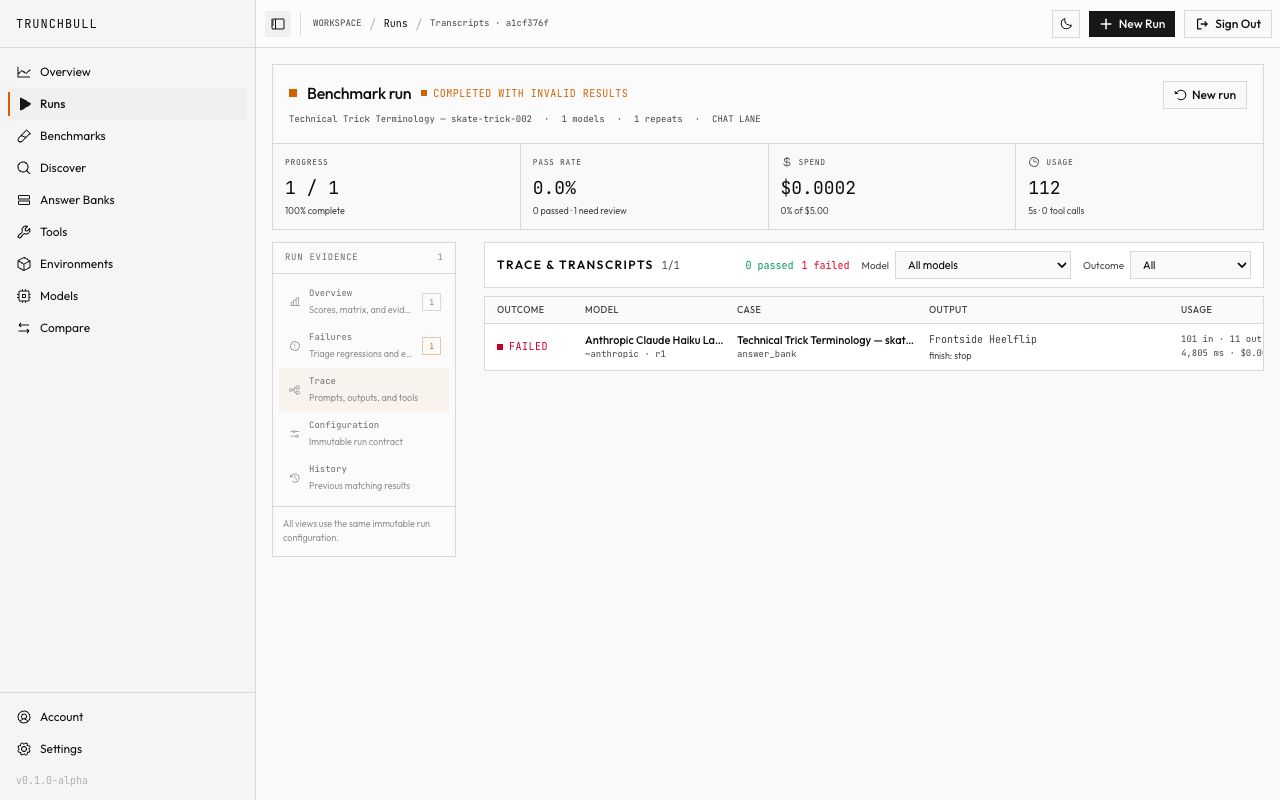
Trace filters make it possible to isolate one model or outcome before opening the underlying response and tool activity.
□ Candidate clears every hard gate
□ Regressions are inside the allowed tolerance
□ Failures are model-caused, not infrastructure-caused
□ Cost and latency fit the production envelope
□ Evidence is published for reviewers
Next step
If the benchmark uses functions or external systems, continue with tool-use testing.